Multi-Output Regression Plots
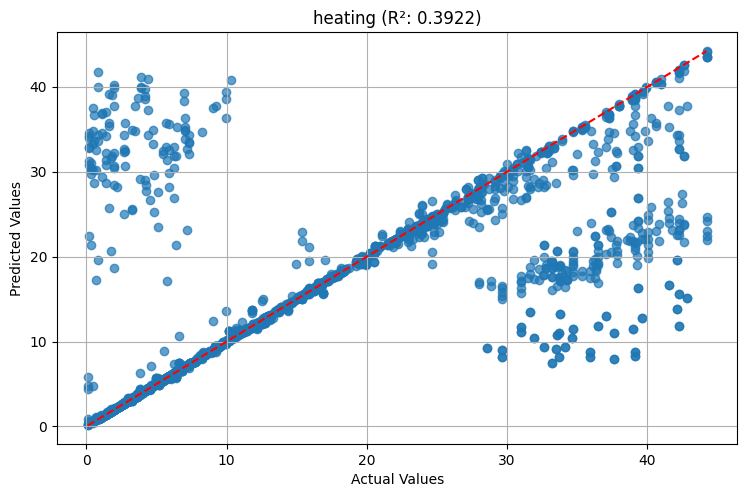
heating
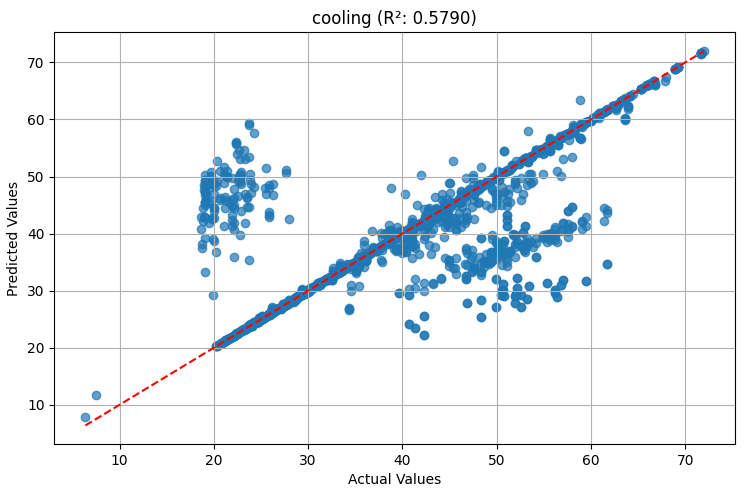
cooling
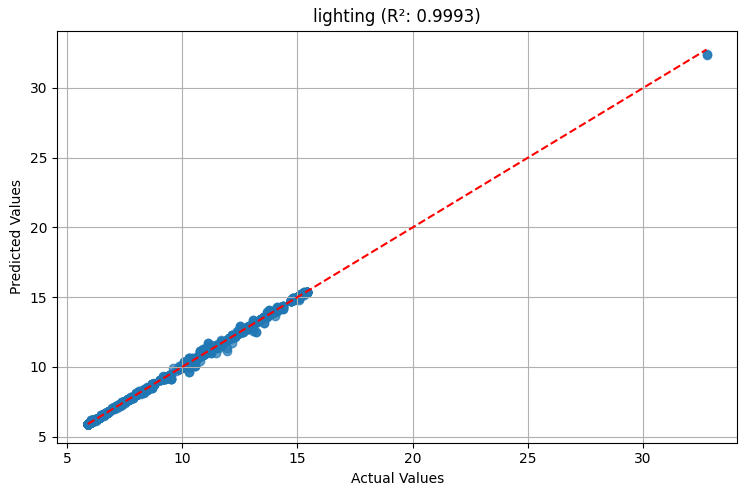
lighting
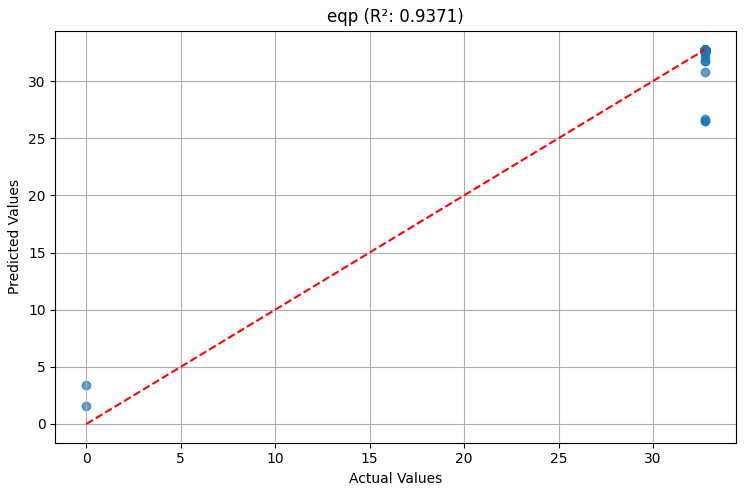
equipments
Visualize and compare performance metrics across different models
Among all 6,000 data samples from the generated dataset, 2,000 samples were split as the test data. These samples had not been seen by the trained models, and this approach was used for evaluating and validating the models.
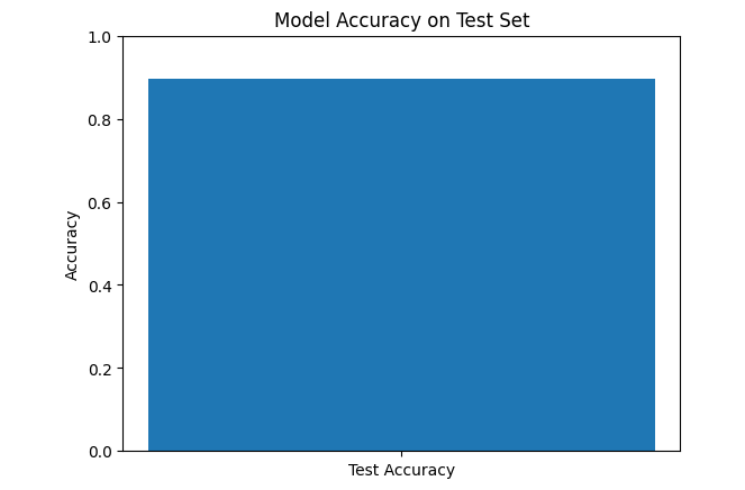
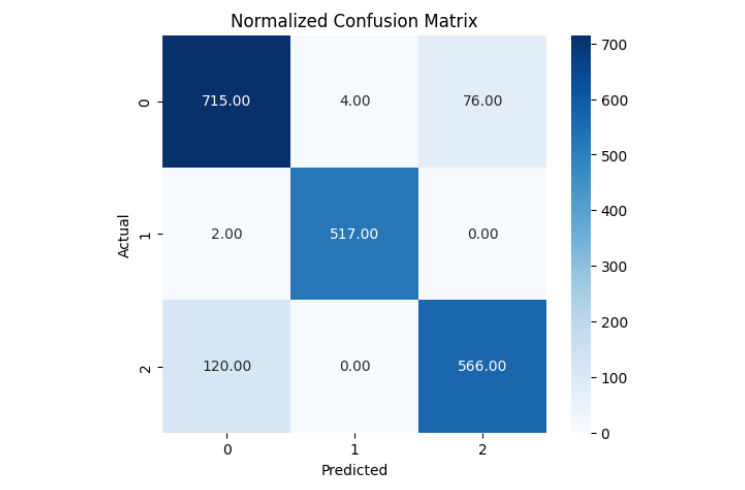
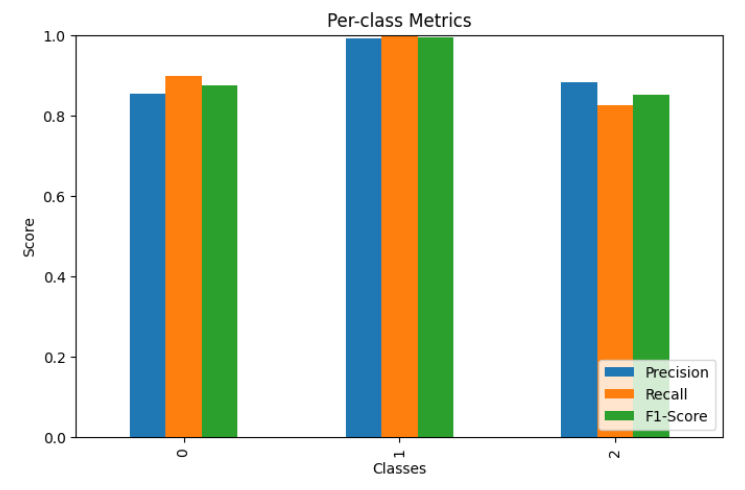
class 0, 1, and 2 represents the EC, EC+, and EC++ respectively.